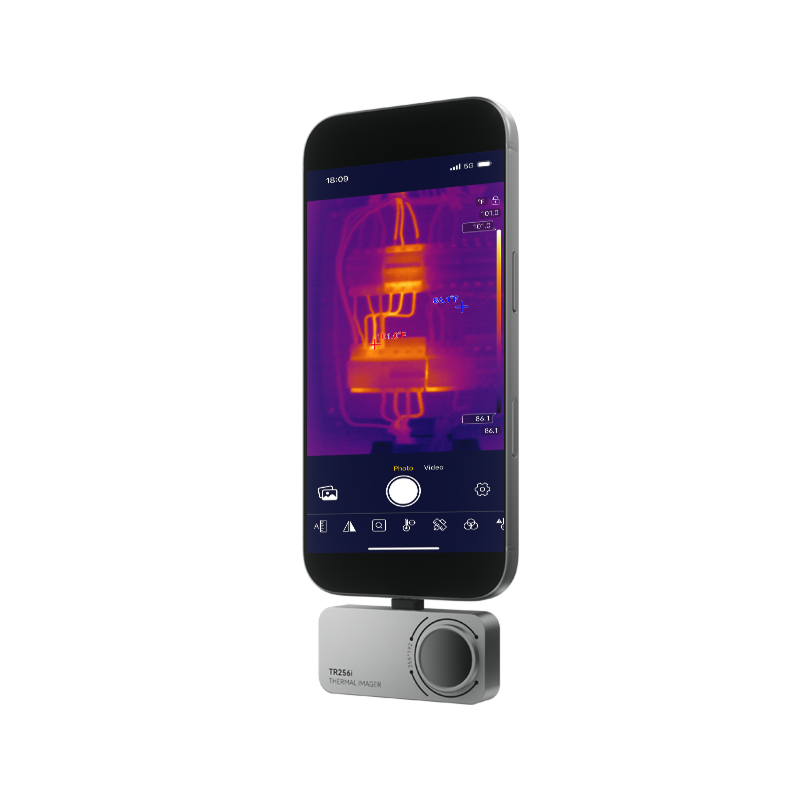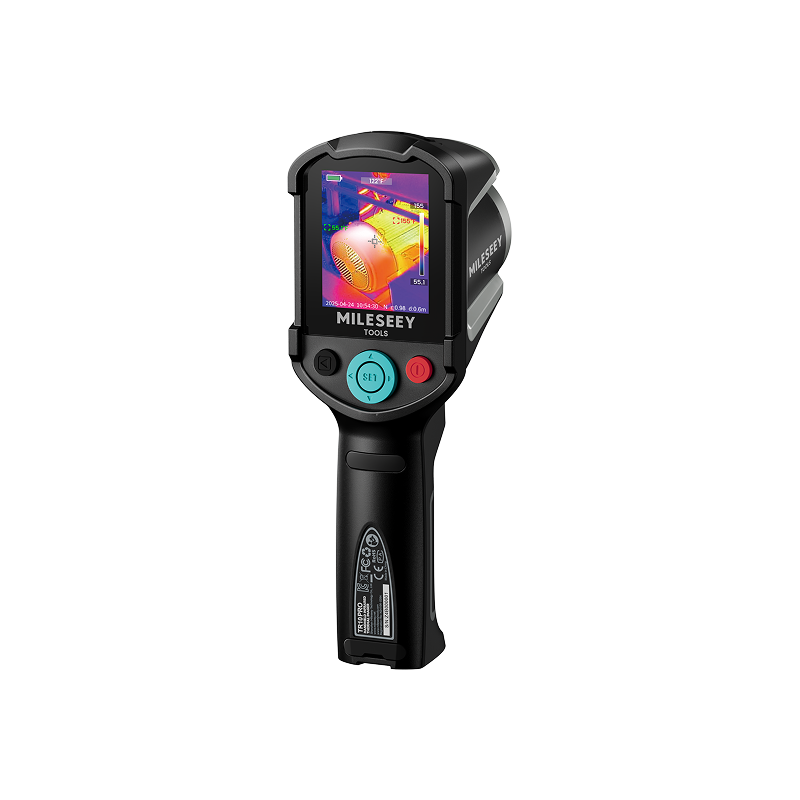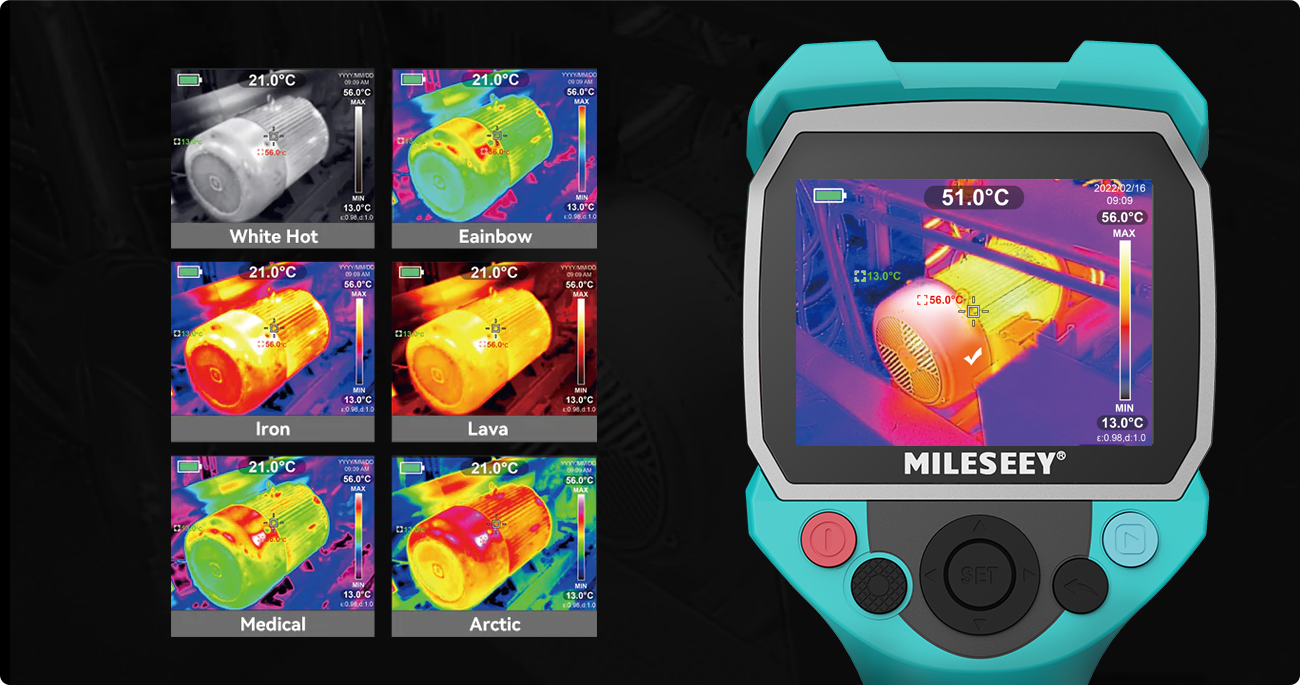
A thermal camera resolution comparison should begin with the detector, not the screen. Native infrared resolution tells you how many physical sensing elements sample the scene. Display resolution tells you how the captured image and interface can be shown. Digital zoom enlarges part of that captured image. These numbers can all be useful, but they are not interchangeable.
This guide compares common detector grids by pixel count, then shows how optics, distance, target size, and thermal sensitivity determine whether those pixels become useful detail.
How this guide was prepared: The comparison uses detector-grid arithmetic and technical guidance from FLIR, FLIR's lens and spatial-resolution guide, and NIST research on infrared thermography. MILESEEY values are taken from official product and Support materials; they have not been independently laboratory tested for this article.
Sensor Resolution, Display Resolution, and Zoom
The word “resolution” appears in several places on a specification sheet. Use the following distinctions before comparing cameras.
| Term | The question it answers | How to use it |
|---|---|---|
| Native IR resolution | How many physical detector elements sample infrared energy? | Use it as the starting point for spatial-detail comparisons. |
| Display resolution | How many pixels can the camera screen show? | Use it to assess viewing and interface presentation, not detector detail. |
| Digital zoom | How much can the captured image be enlarged on screen? | Use it to inspect captured pixels more closely; do not count it as added measurements. |
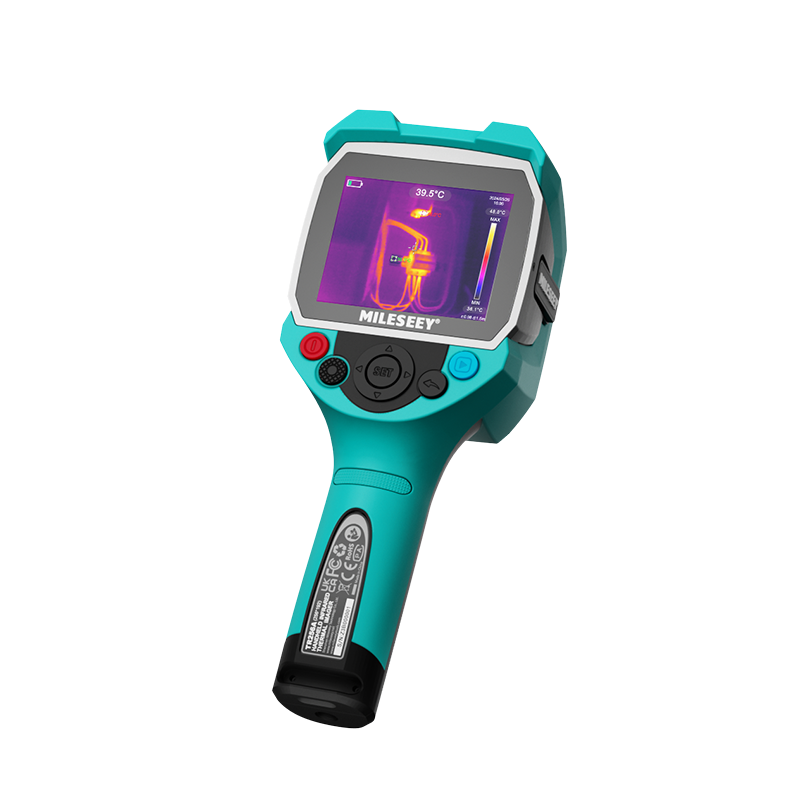
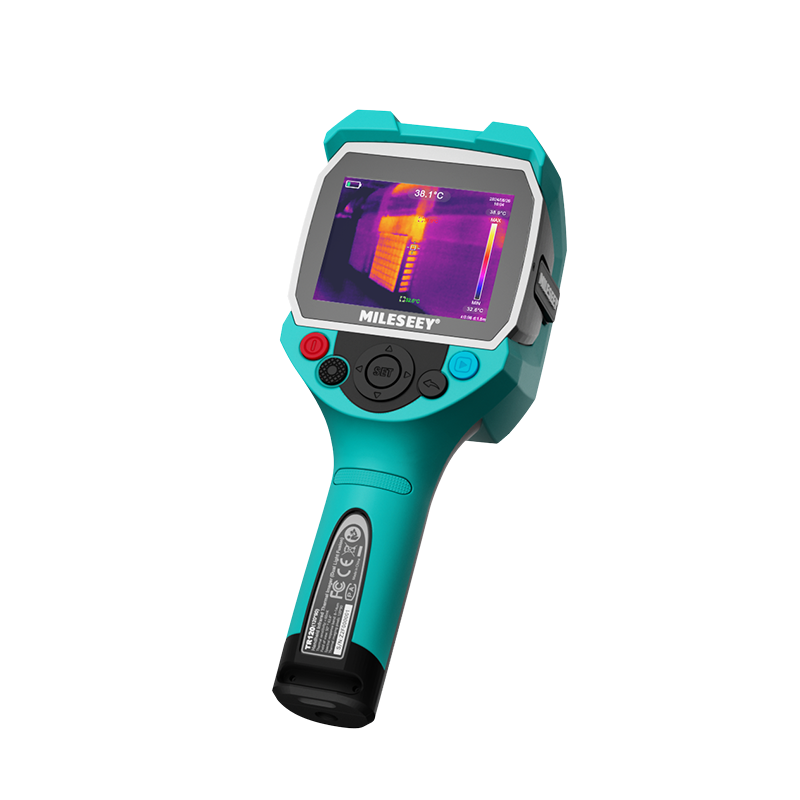
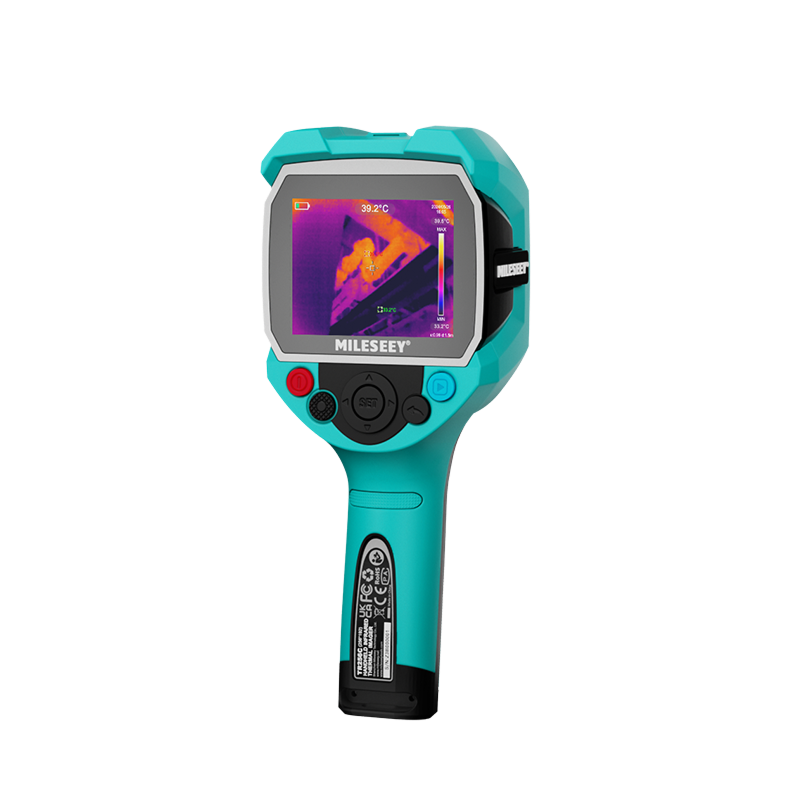
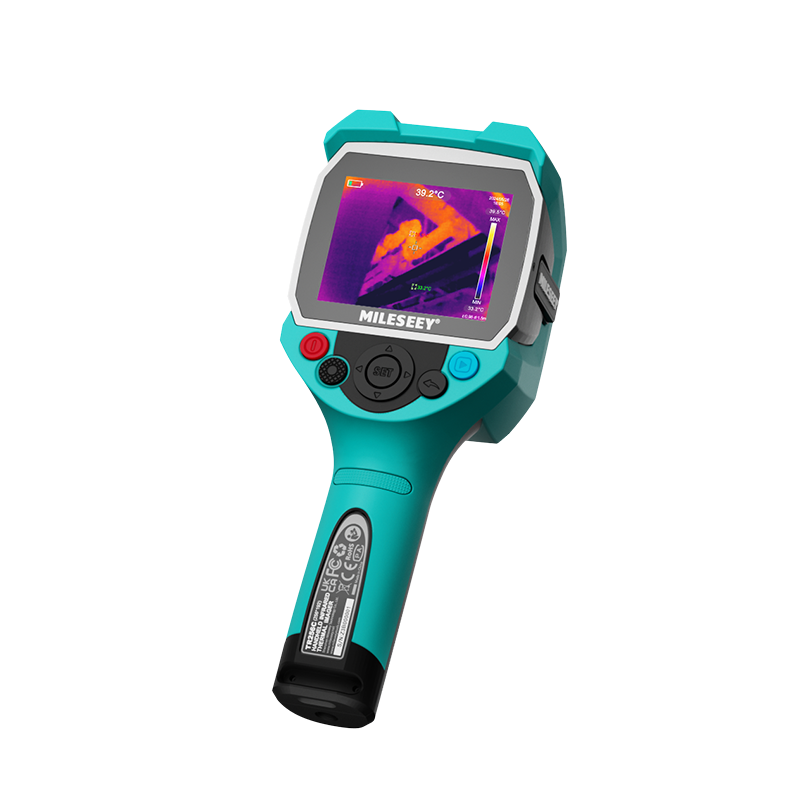
Consider the MILESEEY TR256A. Its official specifications list 256×192 native IR resolution and a 3.5-inch display with 640×480 resolution. The screen contains more display pixels than the detector contains thermal sensing elements. That can support a clear interface and enlarged presentation, but the thermogram still begins with 49,152 native detector pixels.
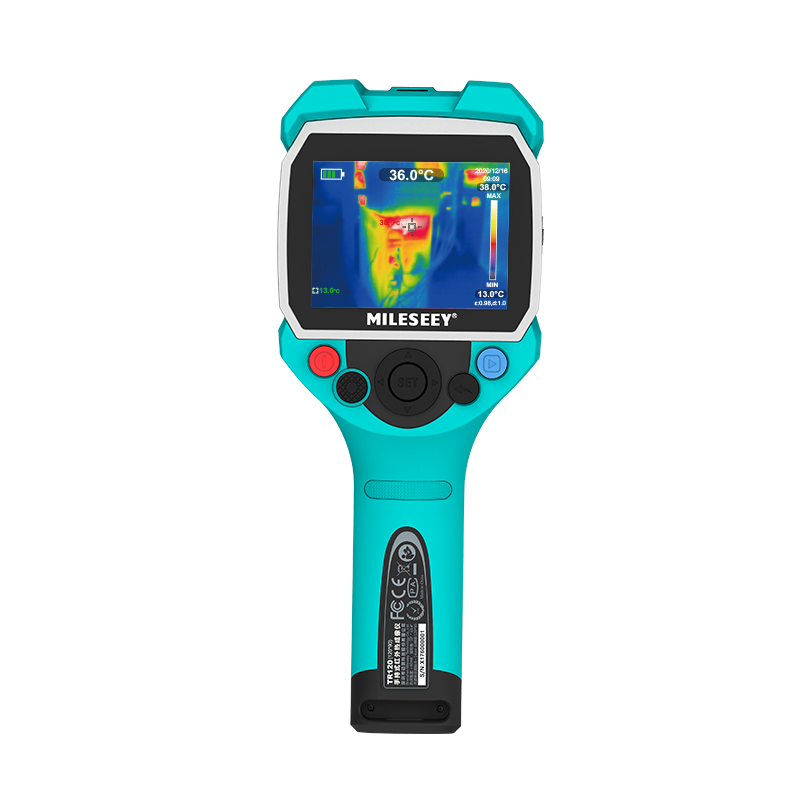
The listed 2× and 4× digital zoom works on the same principle: it enlarges a selected part of the captured thermal image. It does not turn a 256×192 detector into a higher native resolution.
160×120 vs. 256×192 vs. 384×288
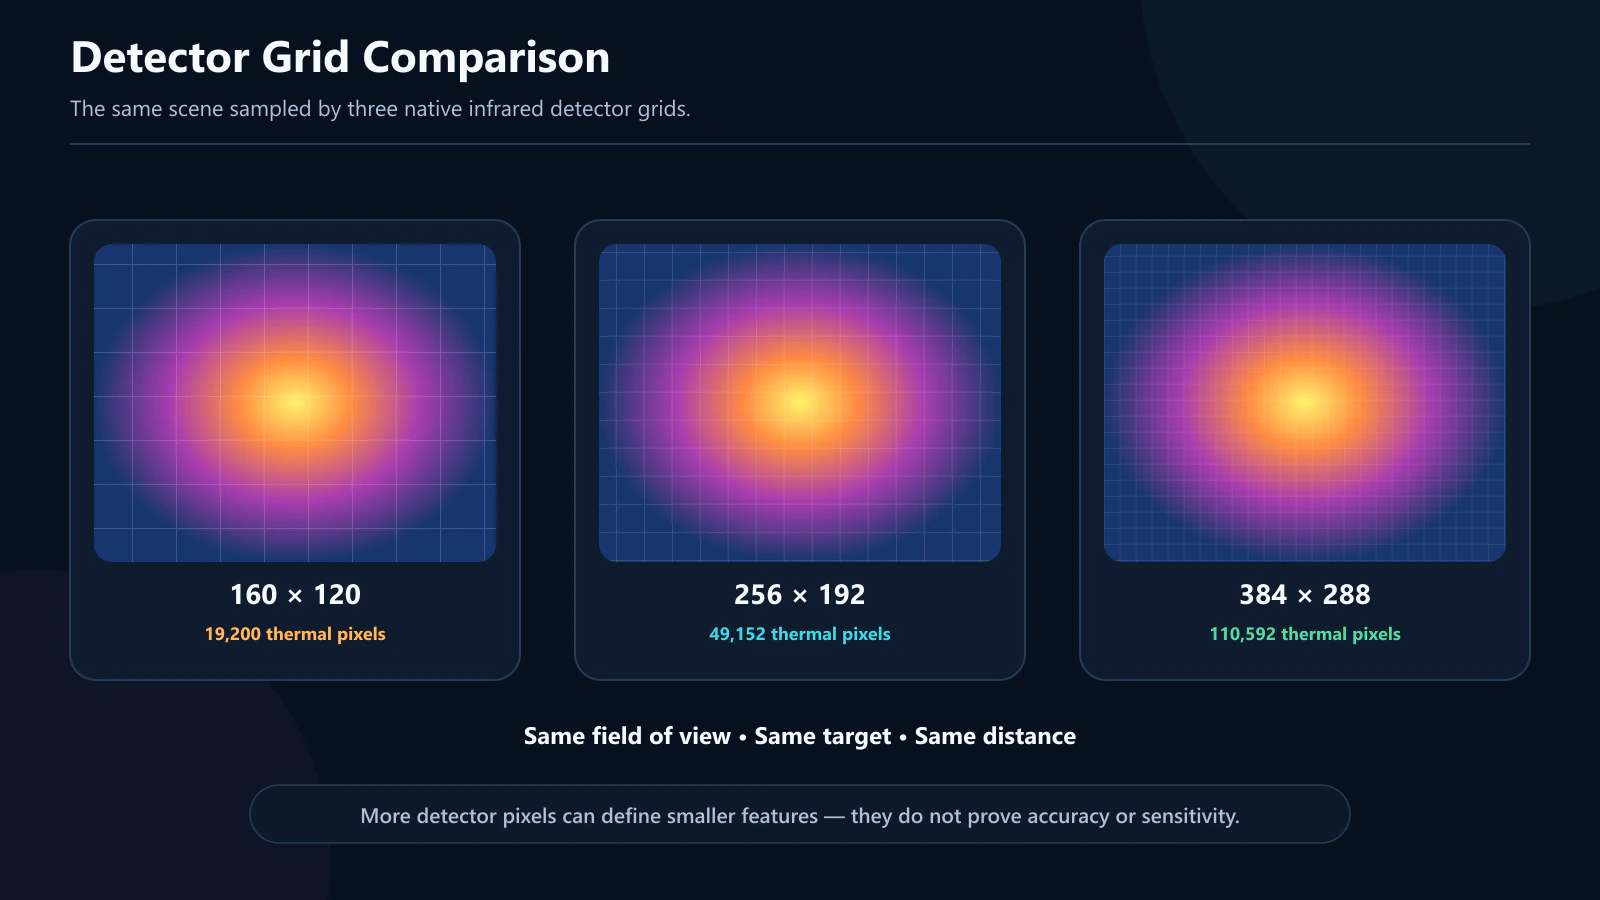
Multiplying width by height reveals the total number of detector elements in each grid. This arithmetic provides a neutral comparison before optics or image processing enter the discussion.
| Native IR grid | Total detector pixels | Relative to 160×120 | What the number means |
|---|---|---|---|
| 160×120 | 19,200 | 1.00× | The baseline in this comparison |
| 256×192 | 49,152 | 2.56× | 2.56 times as many detector samples across the full grid |
| 384×288 | 110,592 | 5.76× | 5.76 times as many detector samples across the full grid |
A 384×288 grid also contains 2.25 times as many pixels as a 256×192 grid. These ratios are exact pixel-count comparisons, not promises that an image will be 2.25 or 5.76 times more useful. The benefit depends on how many of those pixels land on the relevant target and whether the rest of the imaging system preserves the needed contrast.
What More Detector Pixels Can Improve
With comparable optics, framing, focus, and distance, a higher native grid can place more samples across the same object. That may help separate nearby features, preserve context while inspecting a smaller area, or make a small target easier to recognize. It can also offer more flexibility when an image is reviewed later because a crop begins with more native information.
None of those benefits removes the need to focus correctly or move to a suitable working distance. If a small target occupies only a tiny part of a wide scene, its usable pixel coverage can still be low.
What More Detector Pixels Do Not Establish
Native resolution does not by itself establish temperature measurement accuracy, thermal sensitivity, focus quality, lens suitability, environmental stability, or correct emissivity settings. It also does not show that a target is safe to approach or that a thermal pattern has a particular cause.
For the wider system view, start with the high-resolution thermal camera guide. It connects detector resolution with sensitivity, frame rate, optics, and temperature range.
Why Lens, Distance, and Target Size Change the Result
A detector grid samples whatever the lens projects onto it. When the field of view covers a large area, each pixel represents a larger piece of that scene. When the same target is farther away, it usually occupies fewer pixels. This is why two cameras with the same native resolution can perform differently with different optics or at different distances.
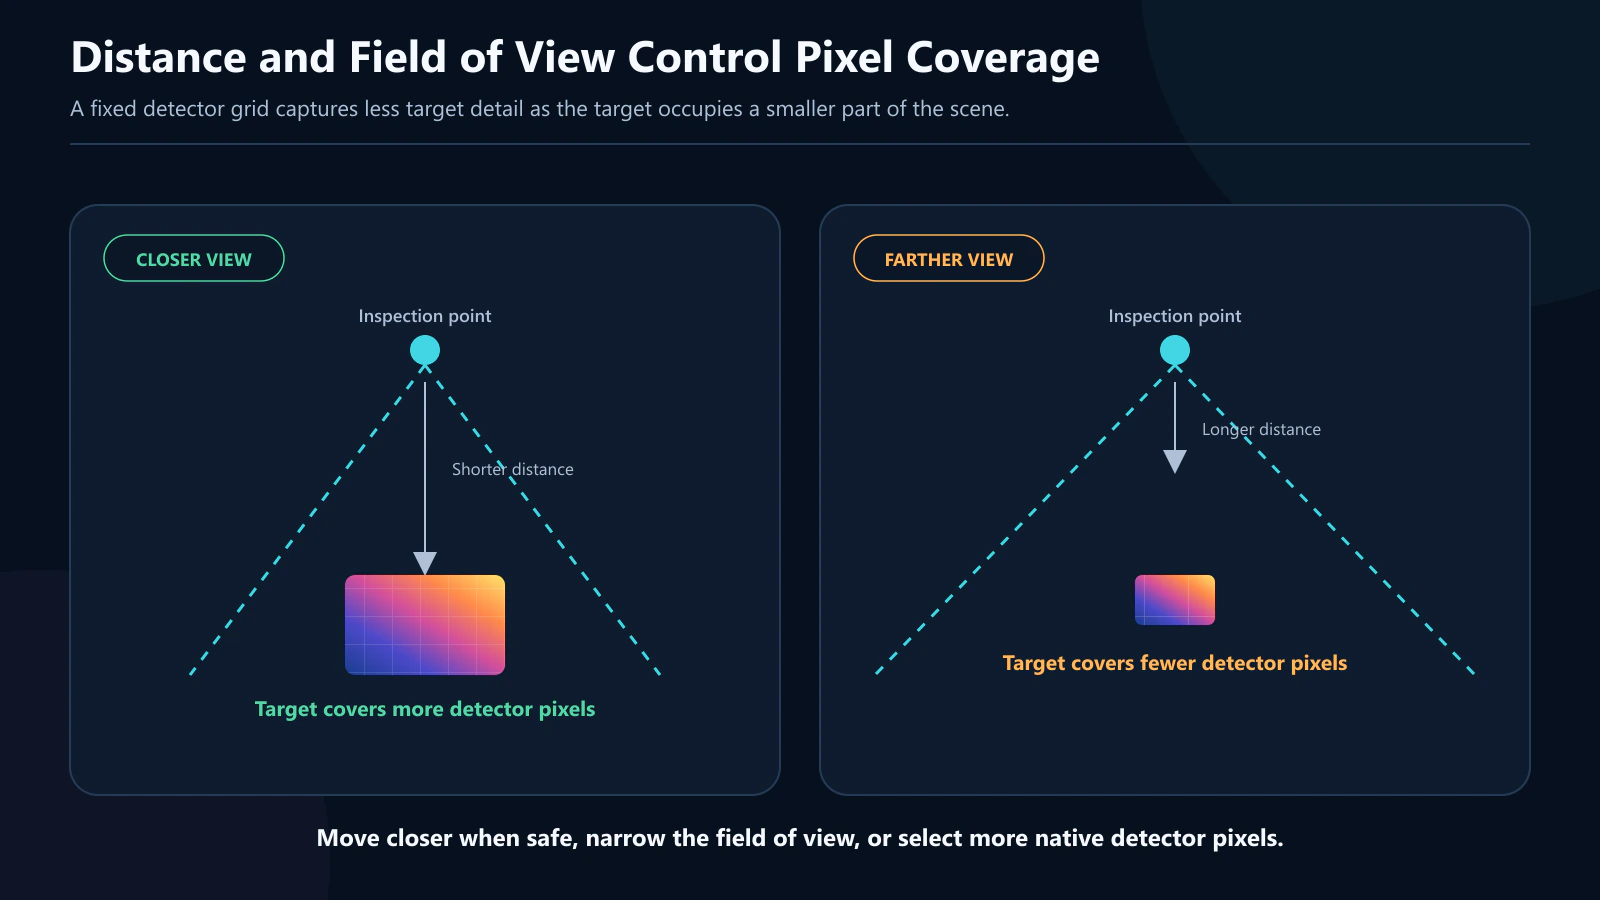
FLIR's explanation of lens choice connects field of view, detector resolution, and spatial resolution. The relevant concept is often expressed as IFOV: the angular area associated with one detector element. For practical comparisons, the key question is not simply “How many pixels does the camera have?” but “How many pixels cover the target at the required distance with this lens?”
Detection and measurement also have different demands. Seeing a thermal anomaly may require fewer target pixels than assigning a dependable temperature to a small area. Avoid inventing a universal distance limit from detector resolution alone; check the camera's optics and apply a procedure appropriate to the task.
A Resolution Comparison Worksheet
Use this worksheet before comparing product pages. It keeps the scene constant and makes assumptions visible.
- Define the target. Record the smallest feature that matters and its approximate dimensions.
- Record the working distance. Use the distance required by access, safety, and the real workflow—not an idealized close-up.
- Hold framing constant. Compare how each candidate would cover the same scene rather than comparing unrelated sample images.
- Compare native IR grids. Calculate total detector pixels, but also consider how many pixels are likely to cross the target.
- Check lens and focus information. A detector cannot recover detail that never reaches it clearly.
- Review NETD for the expected contrast. More pixels do not help if the relevant temperature difference disappears into noise.
- Check the measurement range. Make sure expected target temperatures fit without confusing measurement limits with operating conditions.
- Document surface conditions. Note emissivity, reflections, viewing angle, and any environmental factor that could affect interpretation.
Resolution Priorities by Scene Condition
| Scene condition | Resolution question | Other specification to check |
|---|---|---|
| Small feature within a broad scene | Will enough native pixels cover the feature? | Lens, distance, and focus |
| Large, high-contrast target nearby | Would a moderate grid already provide sufficient coverage? | Measurement method and range |
| Subtle gradient across a surface | Is the spatial grid fine enough to map the pattern? | NETD, emissivity, and reflections |
| Moving handheld scan | Can the target remain identifiable while framing changes? | Frame rate and operator technique |
| Distant target with constrained access | How many pixels will span the target at that distance? | Optics and safe working procedure |
If subtle differences are the main constraint, continue with the NETD and thermal sensitivity guide. If the target may be unusually cold or hot, use the temperature range guide to separate measurement range from operating range.
TR256A: Reading a 256×192 Specification in Context
The TR256A provides a useful worked example because its official specifications separate the detector, display, and related imaging values:
- Native detector: 256×192, or 49,152 thermal sensing elements;
- Detector context: 12 μm pixel pitch and 8–14 μm spectral range;
- Display: 3.5 inches with 640×480 resolution;
- Image refresh: 50 Hz frame rate;
- Sensitivity: official Support specifications list NETD at no more than 50 mK;
- Measurement band: −20°C to 550°C (−4°F to 1022°F);
- Viewing aid: 2× and 4× digital zoom, which enlarges existing detector data.
Official materials also list adjustable emissivity, automatic hot/cold spot tracking, center/hot/cold measurement tools, and high/low temperature alerts. These controls can support an inspection workflow, but they do not add detector pixels or automatically validate an interpretation.
For field-use context, the listed hardware includes a 5000 mAh rechargeable lithium-ion battery, USB-C, IP65 protection, 1.5 m drop resistance, and a 3 W white LED. Those features may influence usability, but they should remain separate from the resolution comparison.
Limits That a Pixel Count Cannot Solve
Thermal cameras image surface infrared energy; they do not see through ordinary walls. A visible temperature pattern may suggest where further investigation is useful, but it does not independently identify the cause. Reflective and low-emissivity surfaces are especially easy to misread because the apparent pattern can include reflected energy. Fluke's discussion of thermography and reflectivity explains this practical limitation.
Resolution is also separate from accuracy. A larger detector grid may define an edge or pattern more clearly while the temperature value still depends on the instrument's measurement characteristics and the setup. For consequential decisions, use a documented method, confirm findings through appropriate means, and involve qualified personnel.
Choose Resolution by Target Coverage
The most defensible resolution choice starts with the smallest relevant target, the required working distance, and the lens. Compare native IR pixels under the same scene conditions, then check sensitivity, frame rate, temperature range, emissivity controls, and environmental limitations.
A 256×192 detector sits between the other grids in this comparison: it contains 2.56 times as many thermal pixels as 160×120, while 384×288 contains 2.25 times as many as 256×192. The correct tier is the one that supplies adequate target coverage without ignoring the rest of the imaging system. If the 256×192 profile fits your worksheet, review the TR256A product page and current official Support specifications before making a decision.