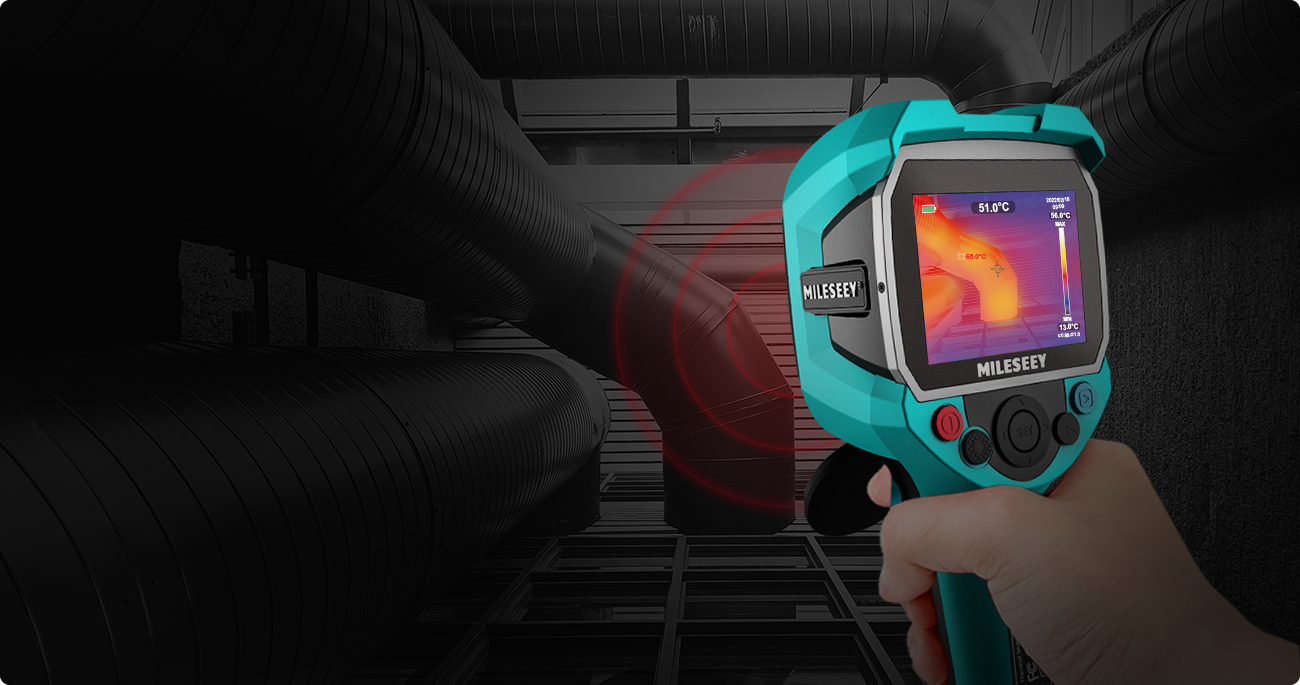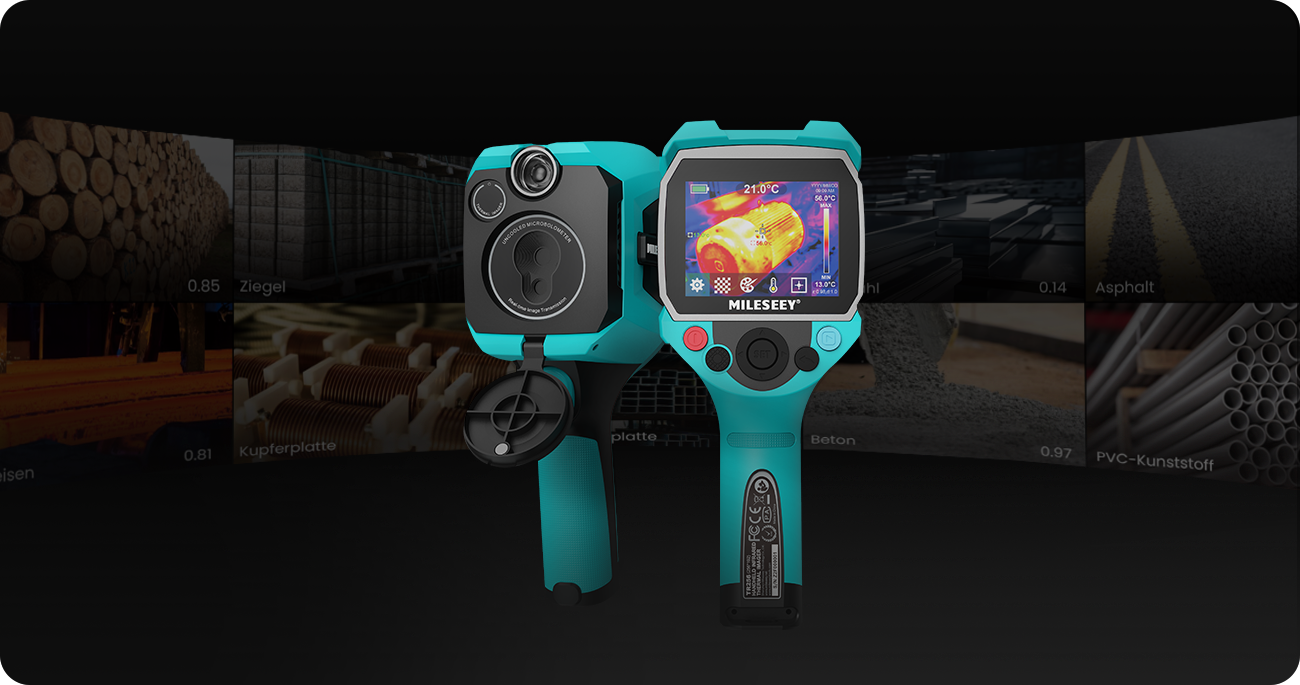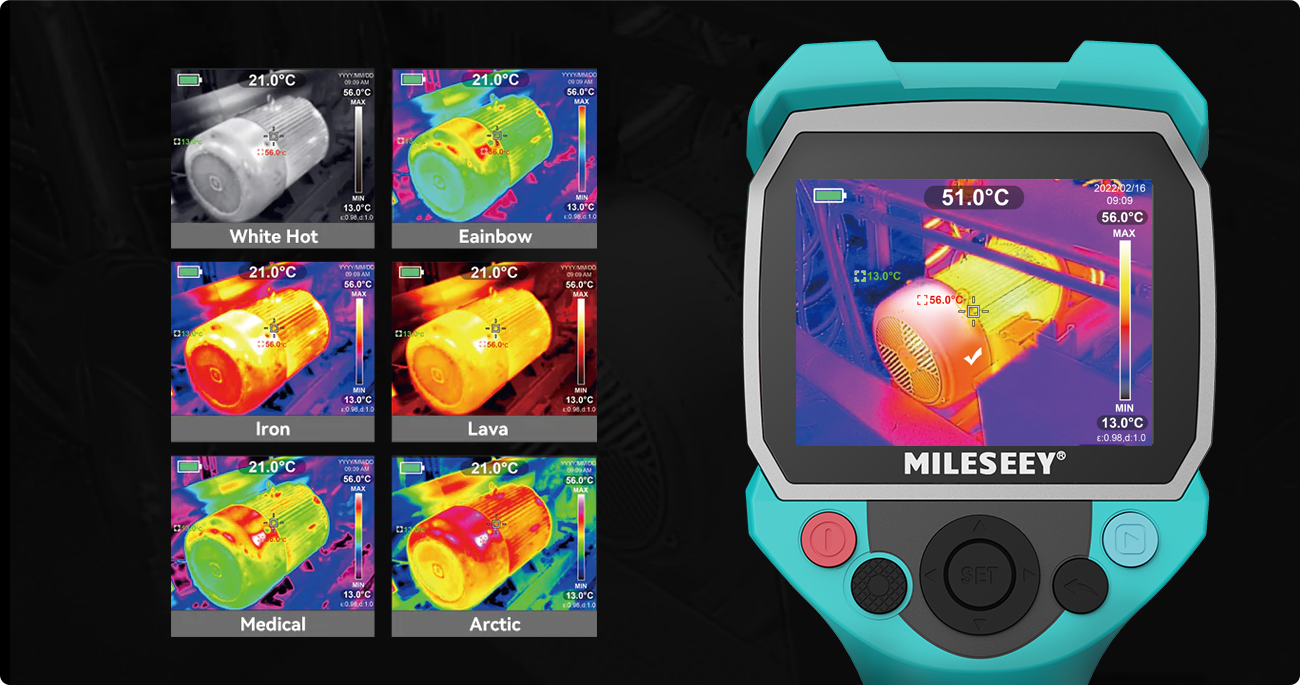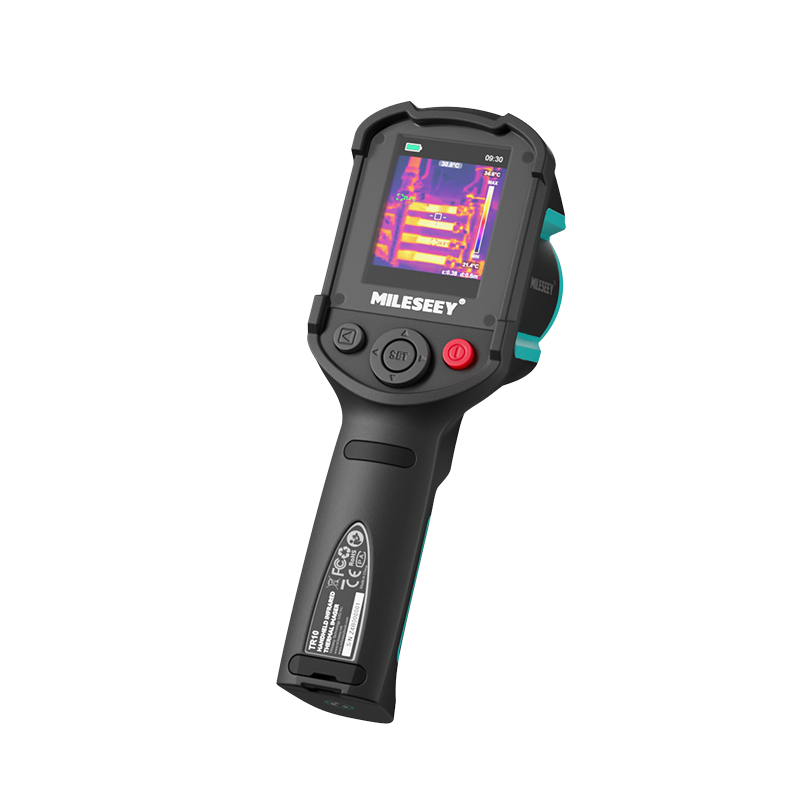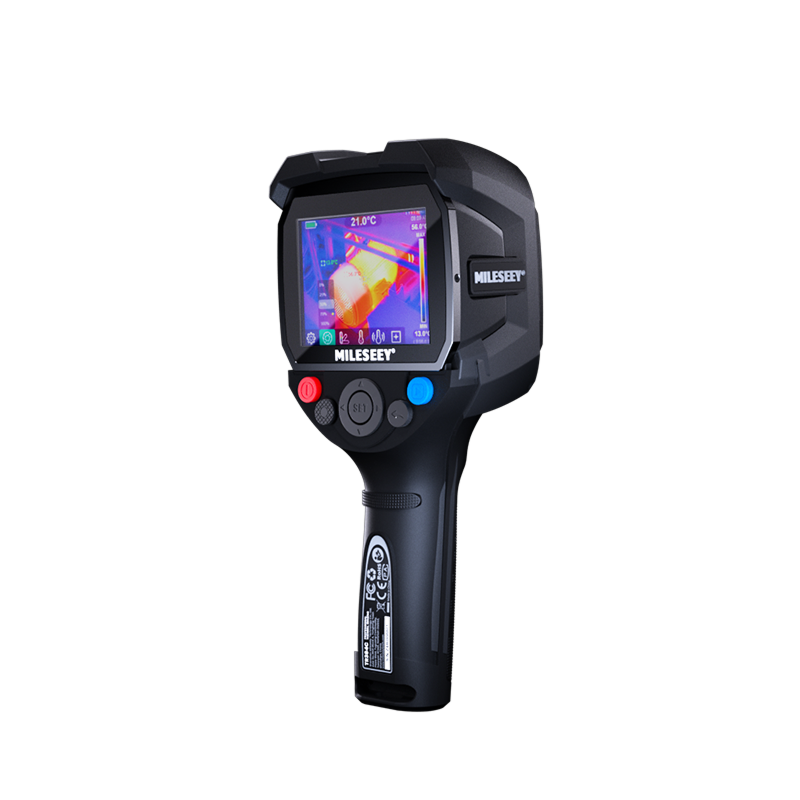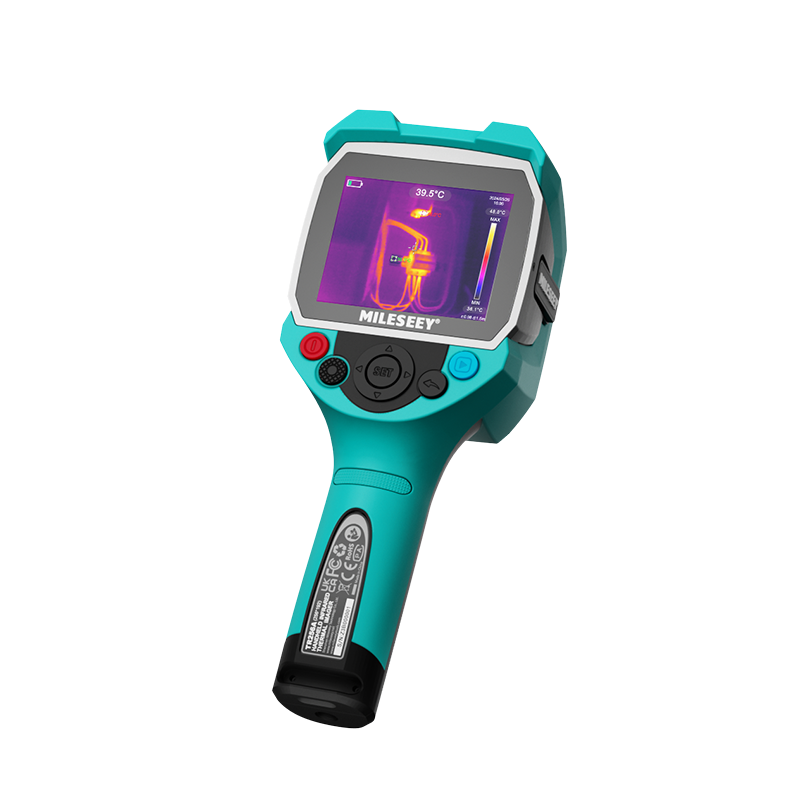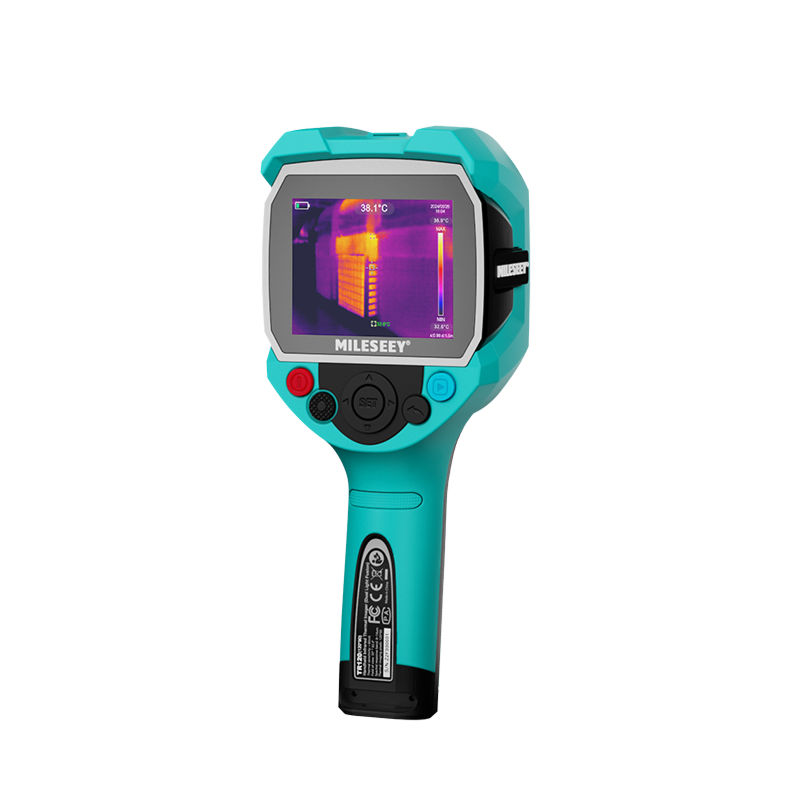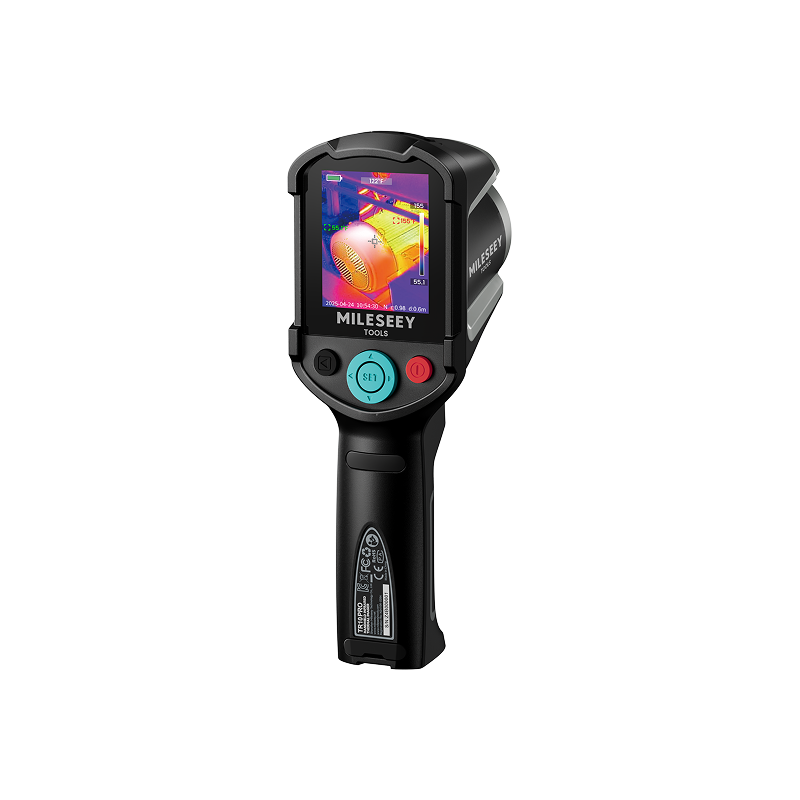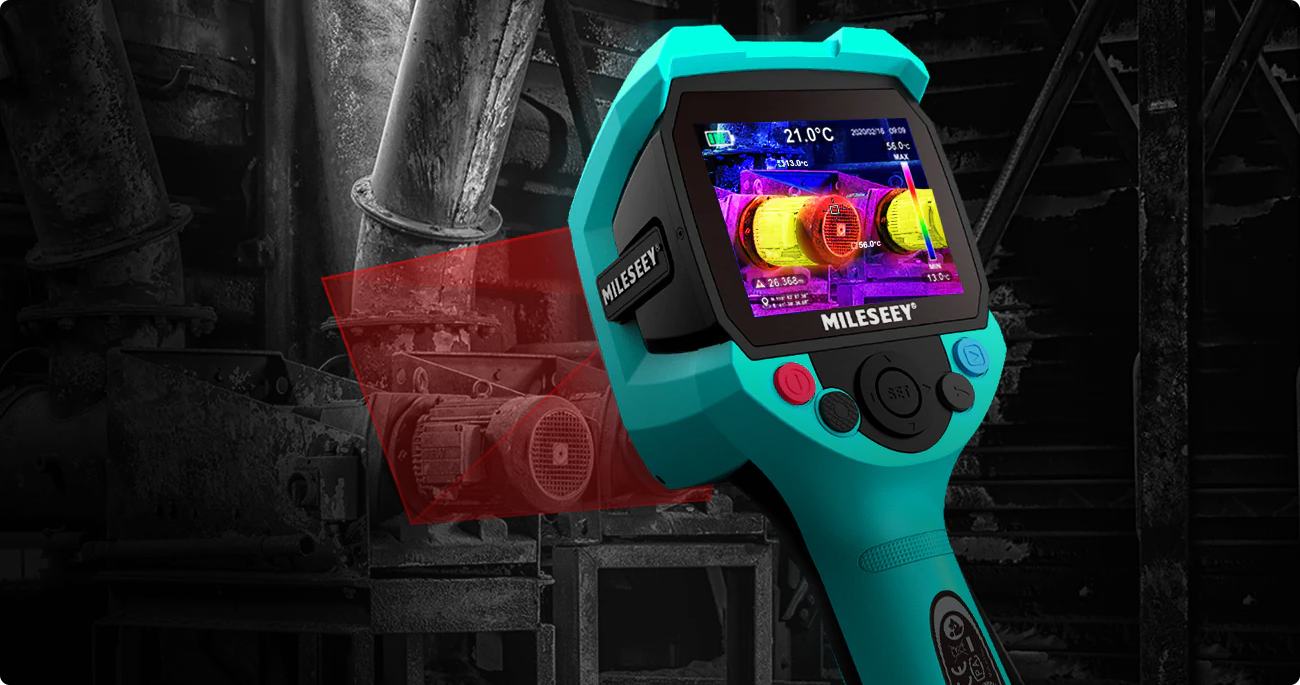
A high-resolution thermal camera can reveal smaller temperature patterns, but detector pixels alone do not determine whether an image is useful. Thermal image quality is the combined result of native infrared resolution, thermal sensitivity, optics, working distance, frame rate, measurement range, and correct setup. A strong specification in one area cannot compensate for a poor match elsewhere.
This guide provides a practical way to read those specifications together. It is intentionally narrower than our general thermal camera buying guide: the focus here is image formation and the decisions that make thermal detail usable.
How this guide was prepared: The technical framework was cross-checked against guidance from FLIR on thermal camera specifications, FLIR on lenses and spatial resolution, research published by NIST, and official MILESEEY product and Support information. Product specifications cited here are manufacturer-listed values, not results of independent laboratory testing.
What “High Resolution” Means in Thermal Imaging
In visible photography, people often judge resolution by the finished image size. A thermal camera starts with a different question: how many infrared detector elements sample energy from the scene? Each detector element contributes a temperature-related measurement to the thermogram. More native detector pixels can divide the same scene into finer spatial samples, provided the lens, focus, distance, and target size allow that detail to reach the detector.
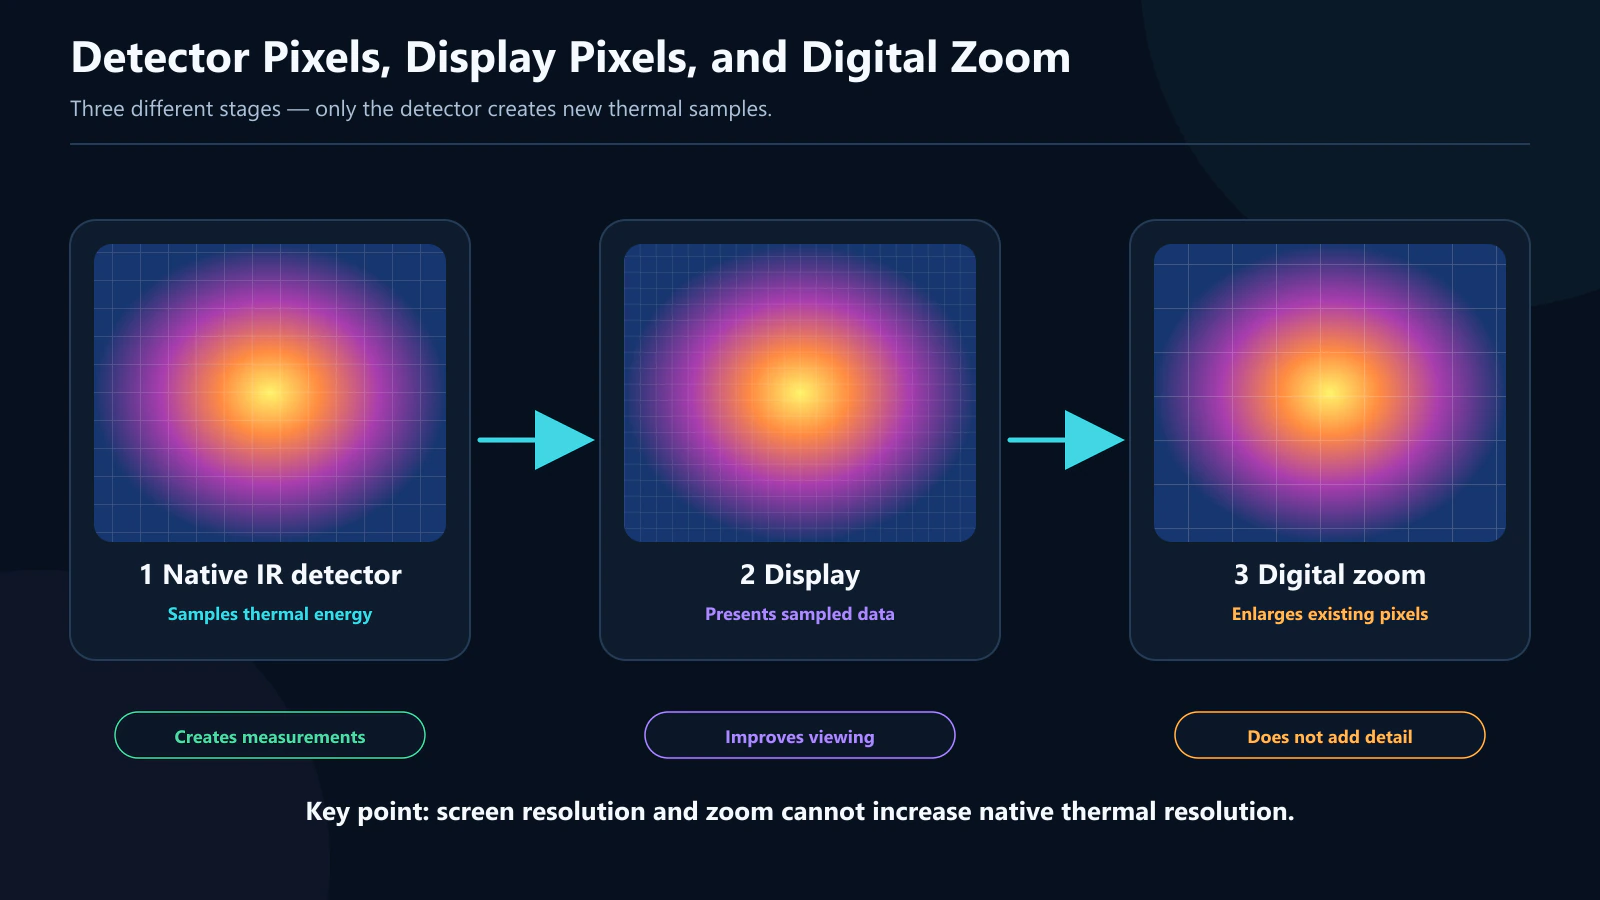
Three numbers are commonly mixed together even though they describe different things:
| Specification | What it describes | What it does not prove |
|---|---|---|
| Native IR resolution | The physical detector grid, such as 256×192 | Measurement accuracy or the quality of the display |
| Display resolution | The pixel grid of the screen used to view menus and images | How many independent thermal samples were captured |
| Digital zoom | An enlarged view of part of the captured thermal image | Additional detector pixels or newly measured scene detail |
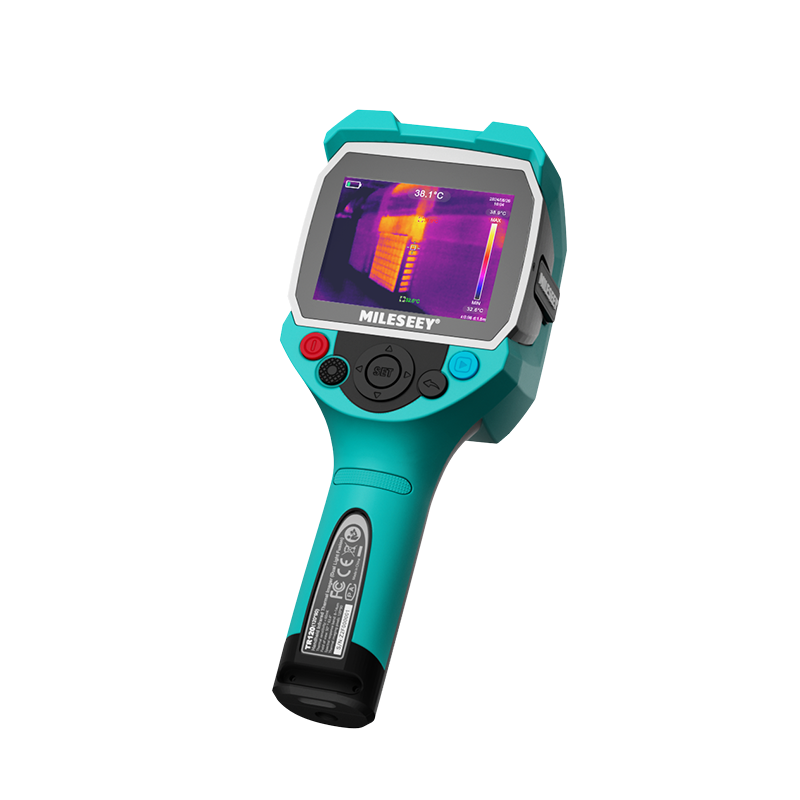
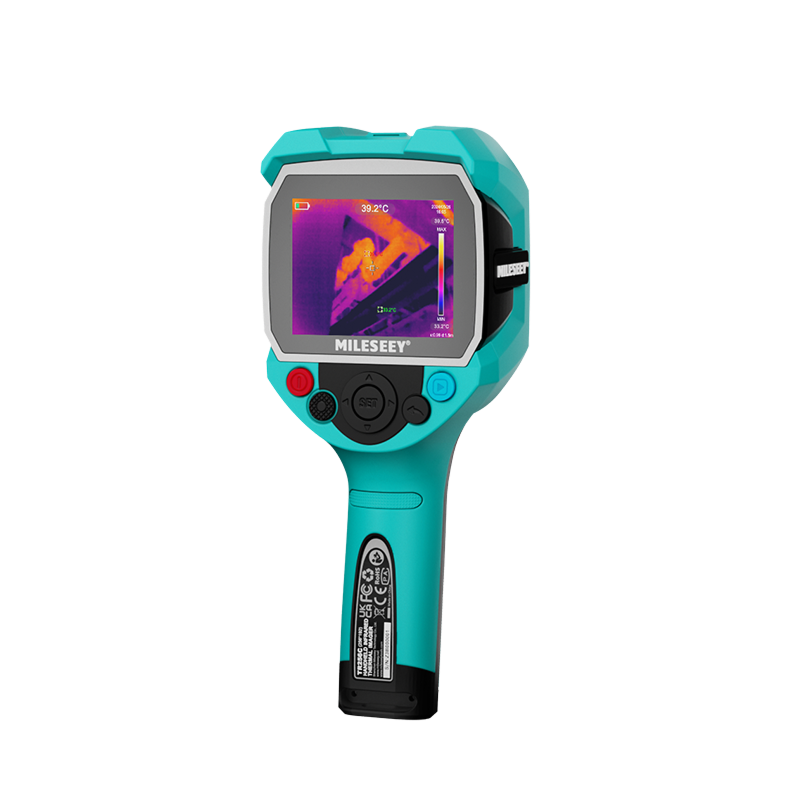
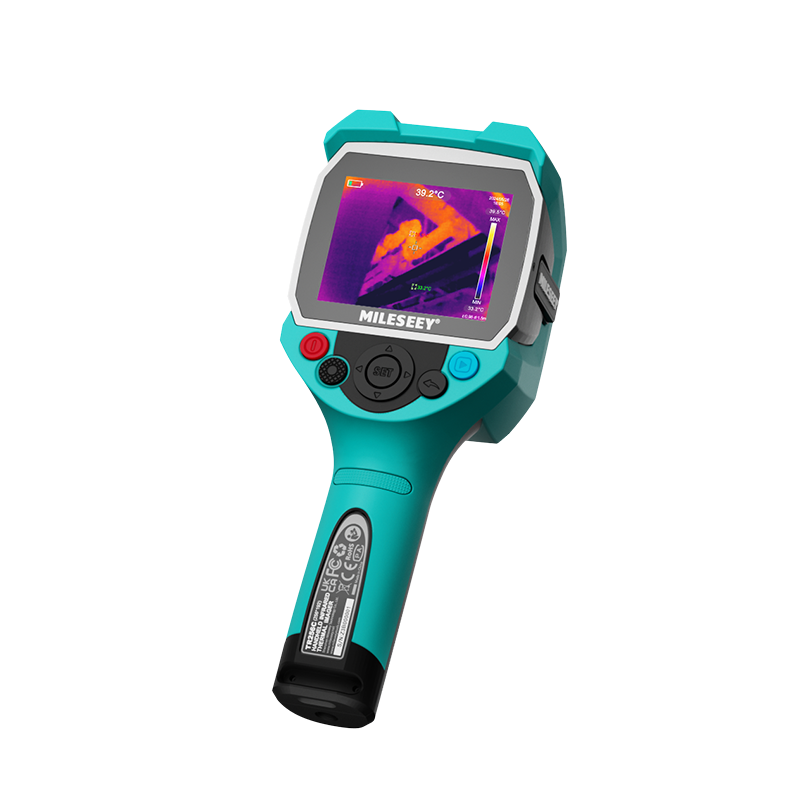
For example, official specifications for the MILESEEY TR256A thermal imaging camera list a 256×192 native IR detector and a 3.5-inch, 640×480 display. The larger display grid can make an interface or enlarged view easier to inspect, but it does not turn the thermal detector into a 640×480 sensor. The same distinction applies to the listed 2× and 4× digital zoom: it magnifies captured pixels rather than creating new thermal measurements.
The Specifications That Shape Thermal Image Quality
A specification sheet becomes more useful when it is read as a system. Start with spatial detail, then check whether the camera can distinguish the temperature differences, motion, and temperature band present in the real task.
1. Native IR Resolution: How Finely the Scene Is Sampled
Native infrared resolution is the most direct starting point for spatial detail. A 256×192 detector contains 49,152 sensing elements. If two cameras view the same scene through comparable optics from the same position, the detector with more native pixels can generally place more samples on a target.
That advantage is conditional. A small component occupying only a few pixels remains difficult to evaluate, even when the total detector count looks impressive. Likewise, poor focus, motion, a reflective surface, or a wide view of a distant target can limit useful detail. For a numeric comparison of common detector grids, see the thermal camera resolution comparison.
2. NETD: Whether Subtle Temperature Differences Remain Visible
Noise-equivalent temperature difference, or NETD, describes thermal sensitivity. It is commonly stated in millikelvin. A lower listed NETD indicates that the imaging system can distinguish smaller temperature differences under the specified test conditions. That can matter when a scene has low contrast, such as neighboring surfaces with only a slight thermal difference.
NETD is not the same as measurement accuracy. Sensitivity concerns the camera's ability to separate small differences in the image; accuracy concerns how closely a reported temperature agrees with a reference under stated conditions. The official TR256A Support specifications list NETD at no more than 50 mK. Treat that as a manufacturer specification, and use the dedicated NETD thermal camera guide to understand when the number is likely to matter.
3. Optics, Field of View, and Working Distance
The lens decides how much of the scene reaches the detector. A wider view captures more area, but a fixed target may occupy fewer pixels. A narrower view can place more detector pixels across a distant target, while showing less surrounding context. This relationship is why resolution cannot be evaluated independently of working distance and field of view.
Spatial resolution is often discussed through instantaneous field of view, or IFOV. As FLIR's lens guidance explains, lens choice and distance affect how much area each detector pixel represents. Do not assume that a high detector count guarantees a reliable reading from any distance. The target must be large enough in the image, and measurement work often needs more coverage than simple detection.
4. Frame Rate: How Smoothly a Changing Scene Is Captured
Frame rate describes how frequently the camera refreshes the thermal image. A higher rate can make handheld scanning and changing scenes appear smoother, which can help an operator keep context while moving. It does not increase native detector resolution or replace good focus and stable technique.
The TR256A specifications list a 50 Hz frame rate. That value should be considered alongside the 256×192 detector and sensitivity specification, not as a stand-alone quality score.
5. Temperature Range: Whether the Expected Target Fits the Instrument
A camera's measurement range defines the temperatures it is designed to report, not the amount of spatial detail in an image. A very broad range can be valuable when expected targets vary widely, but it does not automatically make low-contrast scenes clearer. The TR256A's official measurement range is listed as −20°C to 550°C (−4°F to 1022°F).
Measurement range should not be confused with the temperature conditions in which the camera itself may be operated. The thermal camera temperature range guide explains that distinction and offers a range-selection workflow.
A Decision Matrix for Image-Quality Priorities
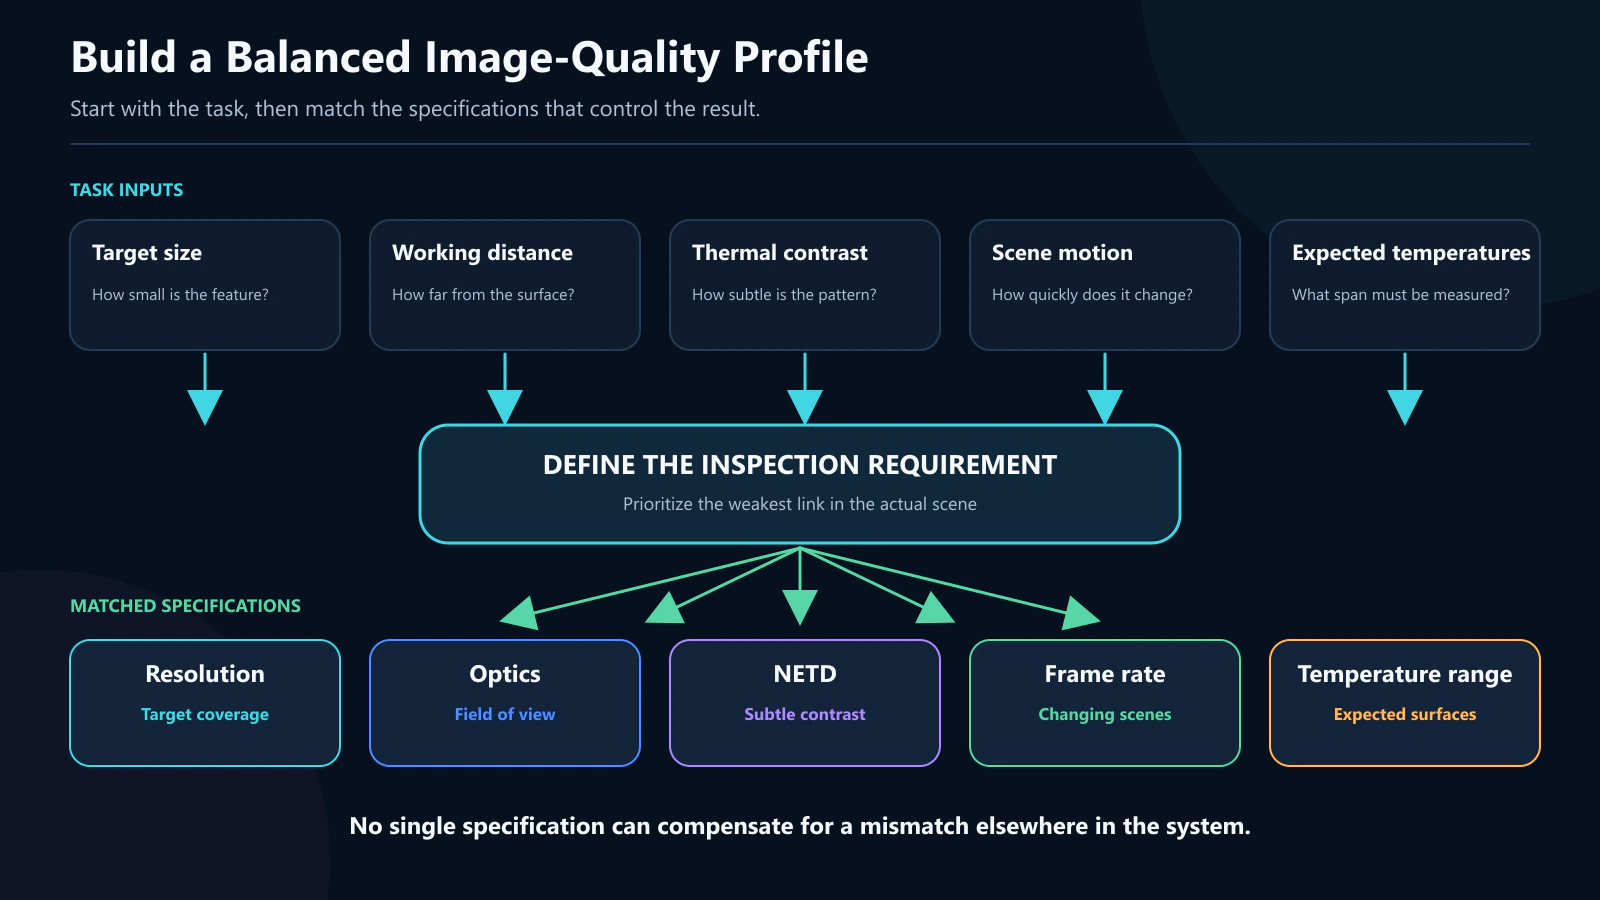
Instead of asking for the single “best” thermal resolution, identify the condition most likely to limit the task. The following matrix is a planning tool, not a substitute for a site-specific procedure.
| Task condition | Prioritize first | Then verify | Common mistake |
|---|---|---|---|
| Small target or longer working distance | Native IR resolution and suitable optics | Target pixel coverage and focus | Using display resolution as the detector specification |
| Subtle differences across similar surfaces | Low NETD and stable technique | Emissivity, reflections, and environmental effects | Treating sensitivity as measurement accuracy |
| Handheld scan of a changing scene | Usable frame rate | Focus, working distance, and operator stability | Assuming frame rate creates more spatial detail |
| Very cold or hot expected target | Appropriate measurement range | Operating conditions and safe access | Choosing the widest range without checking the actual band |
| Reflective or low-emissivity surface | Measurement method and surface understanding | Emissivity setting and reflected temperature influences | Trusting a sharp image as proof of a reliable temperature value |
How to Read a Thermal Camera Specification Sheet
Use the same order every time so a headline number does not dominate the comparison.
- Define the smallest relevant target. Record its approximate size and the practical working distance.
- Check native IR resolution. Ignore display resolution and digital zoom for this step.
- Review optics and field of view. Ask whether the target will occupy enough detector pixels at the required distance.
- Match sensitivity to expected contrast. Low-contrast scenes put more emphasis on NETD and environmental control.
- Confirm frame rate for the way the camera will move. A static setup and a handheld scan may have different practical needs.
- Place expected temperatures inside the measurement range. Then separately verify the allowed operating environment.
- Check measurement controls. Adjustable emissivity, spot tools, and alert functions can support a repeatable workflow, but they do not correct a poor setup automatically.
- Document limitations. Note reflections, distance, focus, environmental conditions, and any assumption that affects interpretation.
TR256A as a Worked Specification Example
The TR256A illustrates how to assemble a specification profile without turning one number into a verdict. Official product and Support materials list the following features:
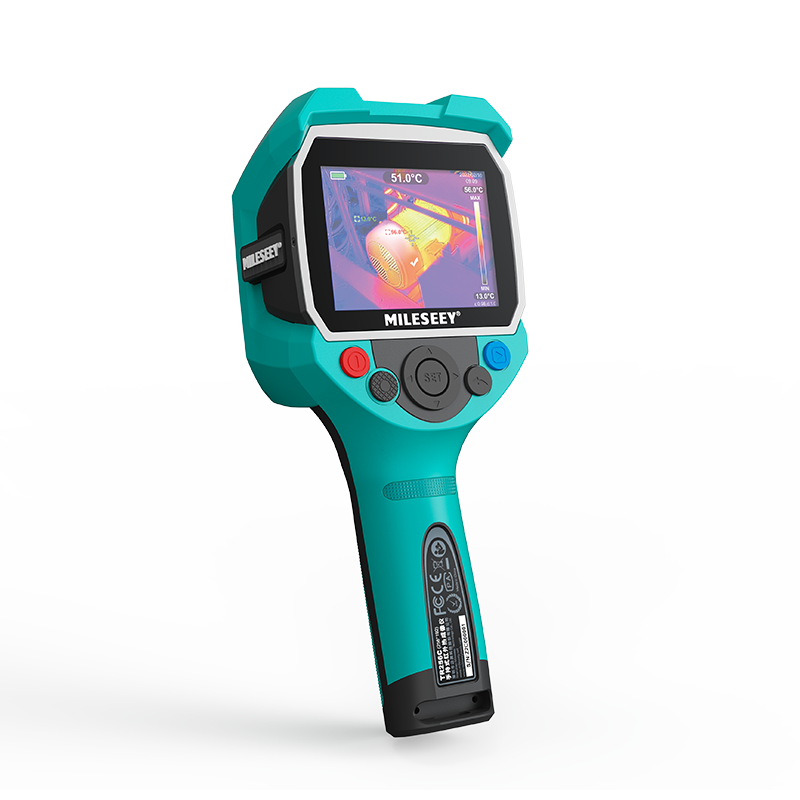
- 256×192 native infrared resolution with 12 μm pixel pitch;
- 8–14 μm spectral range and a 50 Hz frame rate;
- NETD of no more than 50 mK in the official Support specifications;
- −20°C to 550°C (−4°F to 1022°F) measurement range;
- adjustable emissivity, center/hot/cold measurement tools, automatic hot/cold spot tracking, and high/low temperature alerts;
- a 3.5-inch, 640×480 display and 2×/4× digital zoom;
- a 5000 mAh rechargeable lithium-ion battery and USB-C connection;
- IP65 protection, listed 1.5 m drop resistance, and a 3 W white LED.
This combination provides a concrete 256×192 reference for comparison. It does not prove that the camera is appropriate for every target, distance, surface, or measurement procedure. Before choosing it, map the task to the matrix above and review the current official TR256A Support information.
Image Detail Is Not the Same as Measurement Confidence
A crisp thermogram can still be misleading if the surface does not emit infrared energy as assumed. Emissivity varies by material and surface condition, while shiny surfaces can reflect thermal energy from other objects. Fluke's guidance on reflective surfaces describes why apparent hot or cold patterns may be reflections rather than the target's own temperature.
Adjustable emissivity is therefore a useful control, not a guarantee. Operators also need to consider distance, focus, target size, viewing angle, reflected surroundings, and changing environmental conditions. NIST research on infrared thermography likewise highlights the role of emissivity and scene effects in interpreting radiometric information. When a decision is safety-critical or requires traceable measurements, follow an appropriate procedure and use qualified personnel.
Limits and Misconceptions to Avoid
- More display pixels do not create more thermal data. Compare native IR detector resolution first.
- Digital zoom does not increase native resolution. It enlarges a portion of the existing image.
- Resolution is not accuracy. Spatial detail, sensitivity, and temperature measurement performance describe different capabilities.
- A thermal camera does not see through ordinary walls. It images surface infrared patterns, which may provide clues that require further investigation.
- A wide measurement range is not automatically better for every scene. Match the range to expected targets and operating conditions.
- A thermal pattern is not a diagnosis. Confirm important findings with suitable methods and context.
Build a Specification Profile, Not a One-Number Ranking
A useful high-resolution thermal camera is one whose native detector, optics, sensitivity, frame rate, and measurement band fit the same real-world task. Begin with target size and distance, then determine how much thermal contrast must be distinguished and what environmental factors could distort interpretation.
For the next step, compare detector grids in the resolution guide, learn how sensitivity is described in the NETD guide, and match expected temperatures using the temperature range guide. If a 256×192 detector, 50 Hz frame rate, and the manufacturer-listed sensitivity and range align with your checklist, review the TR256A product details and Support specifications before deciding.